Supramassive
Neutron Stars

Stability and Collapse of Rapidly Rotating, Supramassive Neutron Stars
Masaru Shibata
Thomas W. Baumgarte
Stuart L. Shapiro
University of Illinois at Urbana-Champaign
Rotation can support stars with higher mass than the maximum limit for nonrotating, spherical stars, producing
"supramassive" stars. 3D numerical simulations in full general relativity
were performed to study the stability against collapse of rapidly rotating, supramassive
neutron stars at the mass-shedding limit. The cases
seen here are uniformly rotating. In the first case, the star is stable
against collapse. In the second case, an unstable star collapses to a black hole in about a rotation period.
Equilibrium Sequence
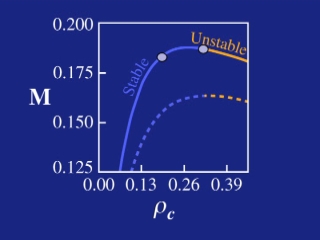 This graph shows the gravitational mass of an equilibrium star as a function of the central
density. All stars are supported by a polytropic equation of state with adiabatic index Gamma = 2. The curves denote the relations for nonrotating spherical
neutron stars (dashed line) and stars rotating uniformly at the mass-shedding limit (solid line). Results from
the numerical simulations showed that the onset of dynamical instability
along the mass-shedding sequence nearly coincides with the onset of secular
instability. The two dots represent the stable and unstable models evolved
below.
This graph shows the gravitational mass of an equilibrium star as a function of the central
density. All stars are supported by a polytropic equation of state with adiabatic index Gamma = 2. The curves denote the relations for nonrotating spherical
neutron stars (dashed line) and stars rotating uniformly at the mass-shedding limit (solid line). Results from
the numerical simulations showed that the onset of dynamical instability
along the mass-shedding sequence nearly coincides with the onset of secular
instability. The two dots represent the stable and unstable models evolved
below.
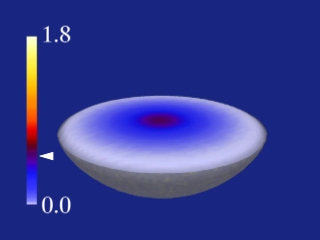
Scene 1: Evolution of Stable Star
This scene shows the density profile in the equatorial plane for
a stable rotating star at the mass-shedding limit as it is evolved. The equatorial radius of the star is 5.1M and the polar radius is
3.4M. The rotational energy divided by the absolute value of the gravitational
energy is T / |W| = 0.087. The color of the star indicates the rest-mass
density. The arrow denotes the initial central density, which remains nearly constant in time.
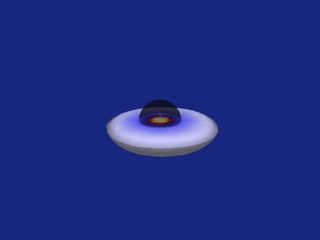
Scene 2 - Part 1: Catastrophic Collapse of Unstable Star to a Black Hole
This scene shows the density profile in the equatorial plane for
an unstable rotating star as it collapses to a black hole. The equatorial radius is 4.2M and the polar radius
is 3.2M. Here T / |W| = 0.080. An apparent horizon appears at the end of the
collapse, denoting the formation of a Kerr black hole. The area of the horizon is A/AKerr = 1.05, close to the exact Kerr value. The angular momentum J/M2 = 0.56, appreciable but below the Kerr limit.
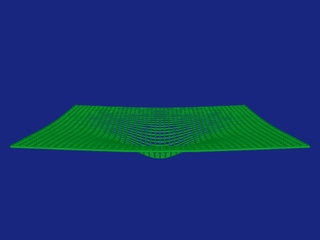
Scene 2 - Part 2: Lapse Profile of Collapsing Star
Here, we see the evolution of the lapse function alpha as the star collapses
to a black hole. The log of the lapse is plotted in the equatorial plane. The
initial central lapse is 0.44. The final central lapse is 0.015. Its rapid plunge indicates the formation of a black hole.
Scientific visualization by
Matthew D. Duez
Eric T. Engelhard
John M. Fregeau
Kevin M. Huffenberger
Patrick T. McGrath
Jared J. Mehl
University of Illinois at Urbana-Champaign
last updated 5 Nov 14 aakhan3