Star III

Star III
Introduction
Rapid Cooling Limit
Evolution of Density Profile
Evolution of Lagrangian Matter Tracers
Introduction
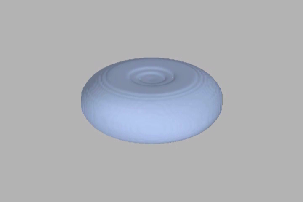
Fig. 1-1 Initial Shape of the Rotating Star
Evolution is performed on a 128x128 grid, with outer boundaries at r/M=17.5, where M is the initial mass of the star. In this simulation, the spin parameter is J/M2=1.0, and M0/M0,sup=1.21 where M0,sup is the mass limit for uniformly rotating polytropes. Figure 1.1 shows the initial shape of the star.
Evolution of the Density Profile (Rapid Cooling Limit)
In the meridional and equatorial clips, the density is plotted on a logarithmic scale normalized to the central density of the star at the start of evolution (Fig. 2-1).
Unlike Stars I and II, Star III does not collapse prior to the termination of the integrations. This does not rule out that Star III might collapse on a longer timescale due, e.g., to further accretion of disk mass onto the core.
Meridional Plane
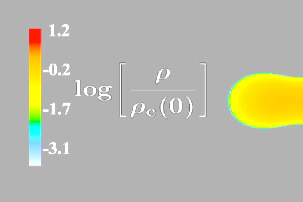 Fig. 2-1 Color code for density profile |
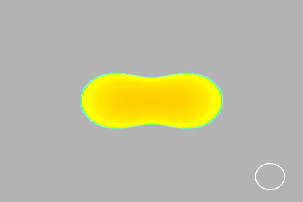 Fig. 2-2 Density profile at t/M = 0 |
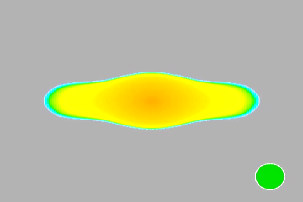 Fig. 2-3 Density profile at t/M = 1160 |
Equatorial Plane
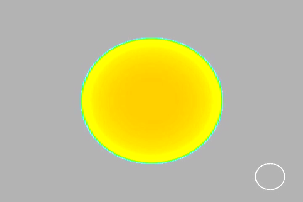 Fig. 2-4 Density profile at t/M = 0 |
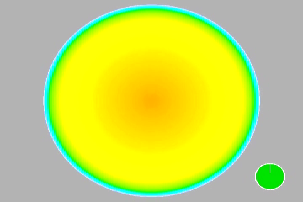 Fig. 2-5 Density profile at t/M = 1160 |
Evolution of Lagrangian Matter Tracers (Rapid Cooling Limit)
In these clips, we place 50,000 Lagrangian matter tracers that represent fluid elements. The initial distribution of Lagrangian tracers is proportional to the initial mass density. We then calculate the trajectories of the tracers by integrating fluid velocities. The particles are also color-coded according to the density at their current location. The color-coding is the same as the density profile clips (Fig. 2-1).
Meridional View
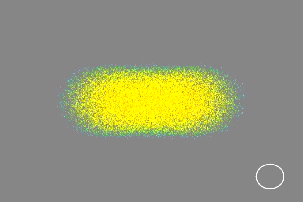 Fig. 3-1 Lagrangian matter tracers at t/M = 0 |
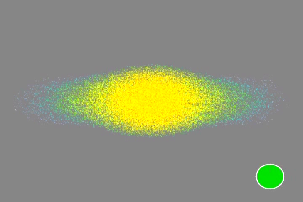 Fig. 3-2 Lagrangian matter tracers at t/M = 1160 |
Equatorial View
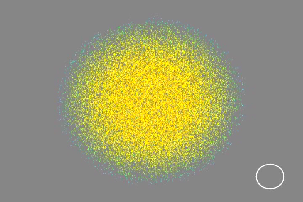 Fig. 3-3 Lagrangian matter tracers at t/M = 0 |
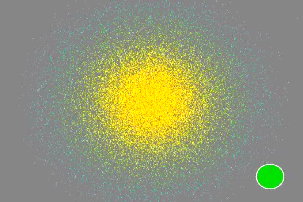 Fig. 3-4 Lagrangian matter tracers at t/M = 1160 |
Last Updated 12 Nov 14 by SEC