Star A2

Star A2
Introduction
Evolution of Density Profile
Zoomed in Evolution
Evolution of Lagrangian Matter Tracers
Introduction
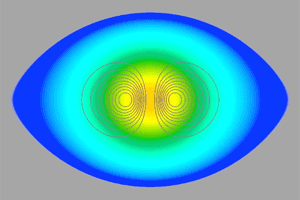
Fig. 1-1 Initial Shape of the Rotating Stellar Core
Evolution is performed on a variable grid, with the grid changing as the characteristic radius of the star changes. The grid is initially 420x420 but finally settles to 1900x1900 as collapse proceeds. In this simulation, the spin parameter is J/M2=1.235, and the mass is 1.5Msolar. Figure 1.1 shows the initial shape of the stellar core and the poloidal magnetic field.
Evolution of the Density Profile
In the meridional clip, the density is plotted on a logarithmic scale.
At t/M=0, the stellar core has an oblate density profile and rotates rigidly (Fig. 2-2). Poloidal magnetic field lines are indicated by the closed loops. Rotational to gravitational potential energy is T/|W|=0.0089. Initially, the core is in the infall phase, in which the star begins collapsing (due to the sudden softening of the EOS) until the central density reaches nuclear density. When the central core density exceeds nuclear density, the infall of the inner core decelerates and rebounds, driving an outgoing shock into the outer core. The shock propagates all the way to the surface of the outer core at R ≈ 1000 km. The inner core then oscillates quasi-radially for about 10 ms before settling down to a steady state (the ringdown phase).
During infall, the toroidal field grows due to winding and the poloidal field due to compression. After the bounce, the magnetic pressure continues to build due to differential rotation surrounding the proto-neutron star. The field then briefly grows through MRI before saturating, resulting in a collimated and nearly stationary field along the rotation axis. An MHD outflow can be seen, driven along the collimated helical field lines near the rotation axis. This creates an evacuated region that can be seen along the rotation axis of the star. The outward transport of angular momentum leads to core spindown.
Three mechanisms drive the outflow: the magneto-spring mechanism (due to toroidal stresses), MRI-induced turbulence, and the Blandford-Payne magneto-centrifugal mechanism (the magnetic field near the PNS is amplified by winding and MRI, launching an outward propagating Poynting flux that injects energy into the wind). The MHD outflow may provide an energy source to power a supernova explosion. Anisotropic MHD outflows may be able to explain high-velocity pulsars. Gravitational waves are emitted during the infall, bounce, and ringdown phases. The latter are modified by the MHD outflow, increasing their amplitudes. They may be detectable for nearby (galactic) events.
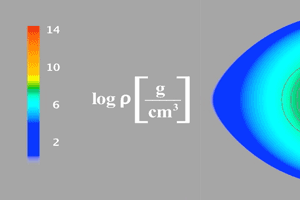 Fig. 2-1 Color code for density profile |
Fig. 2-2 Density Profile at t = 0 |
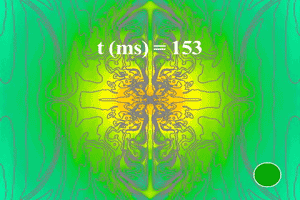 Fig. 2-3 Core density profile at t = 153 ms |
Zoomed in Evolution
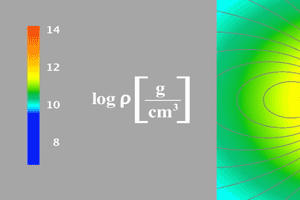 Fig. 3-1 Color code for density profile |
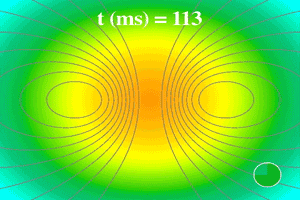 Fig. 3-2 Density profile at t = 113 ms |
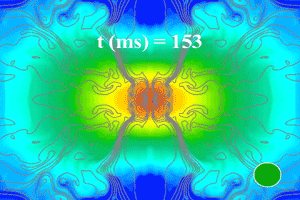 Fig. 3-3 Density profile at t = 153 ms |
Evolution of Lagrangian Matter Tracers
In these clips, we place 20000 Lagrangian matter tracers that represent fluid elements. The initial distribution of Lagrangian tracers is proportional to the initial rest-mass density. We then calculate the trajectories of the tracers by integrating fluid velocities.
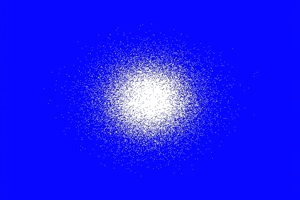 Fig. 4-1 Lagrangian matter tracers at t = 0 |
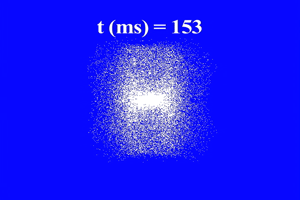 Fig. 4-2 Lagrangian matter tracers at t = 153 ms |
Last Updated 6 Nov 14 by SEC