Star A0

Star A0
Introduction
Evolution of Density Profile
Zoomed in Evolution
Evolution of Lagrangian Matter Tracers
Introduction
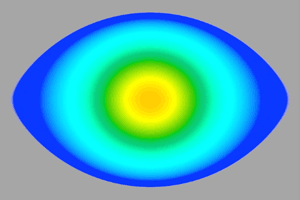
Fig. 1-1 Initial Shape of the Rotating Stellar Core
Evolution is performed on a variable grid, with the grid changing as the characteristic radius of the star changes. The grid is initially 425x425 but finally settles to 2500x2500 as collapse proceeds. In this simulation, the spin parameter is J/M2=1.235, and the mass is 1.5Msolar. Figure 1.1 shows the initial shape of the stellar core.
Evolution of the Density Profile
In the meridional clip, the density is plotted on a logarithmic scale.
At t/M=0, the stellar core has an oblate density profile and rotates rigidly (Fig. 2-2). Rotational to gravitational potential energy is T/|W|=0.0089. This case evolves without a magnetic field. Initially, the core is in the infall phase, in which the star begins collapsing (due to the sudden softening of the EOS) until the central core density reaches nuclear density. When the central density exceeds nuclear density, the infall of the inner core decelerates and rebounds, driving an outgoing shock into the outer core. The shock propagates all the way to the surface of the outer core at R ≈ 1000 km. The inner core then oscillates quasi-radially for about 10 ms before settling down to a steady state (the ringdown phase). A matter outflow is also present along the rotation axis of the star, creating a somewhat evacuated region. With no magnetic field to sustain it, this outflow decays exponentially as the star approaches a steady state.
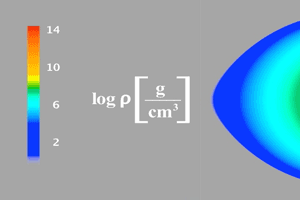 Fig. 2-1 Color code for density profile |
Fig. 2-2 Density Profile at t = 0 |
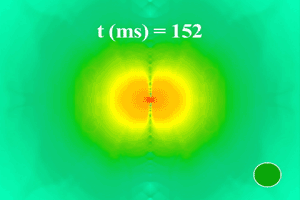 Fig. 2-3 Core density profile at t = 152 ms |
Zoomed in Evolution
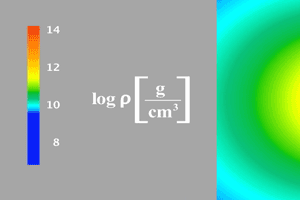 Fig. 3-1 Color code for density profile |
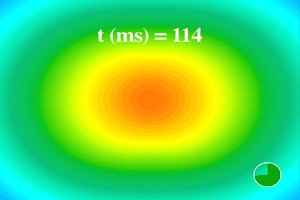 Fig. 3-2 Density profile at t = 114 ms |
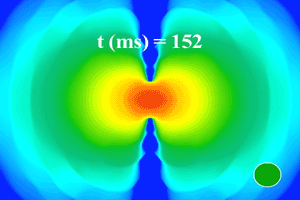 Fig. 3-3 Density profile at t = 152 ms |
Evolution of Lagrangian Matter Tracers
In these clips, we place 20000 Lagrangian matter tracers that represent fluid elements. The initial distribution of Lagrangian tracers is proportional to the initial rest-mass density. We then calculate the trajectories of the tracers by integrating fluid velocities.
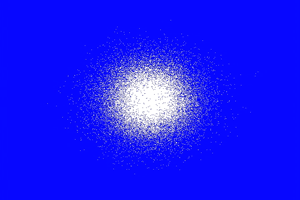 Fig. 4-1 Lagrangian matter tracers at t = 0 |
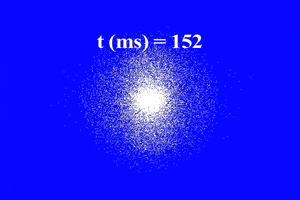 Fig. 4-2 Lagrangian matter tracers at t = 152 ms |
Last Updated 6 Nov 14 by SEC