Part II: 3D Density Profiles

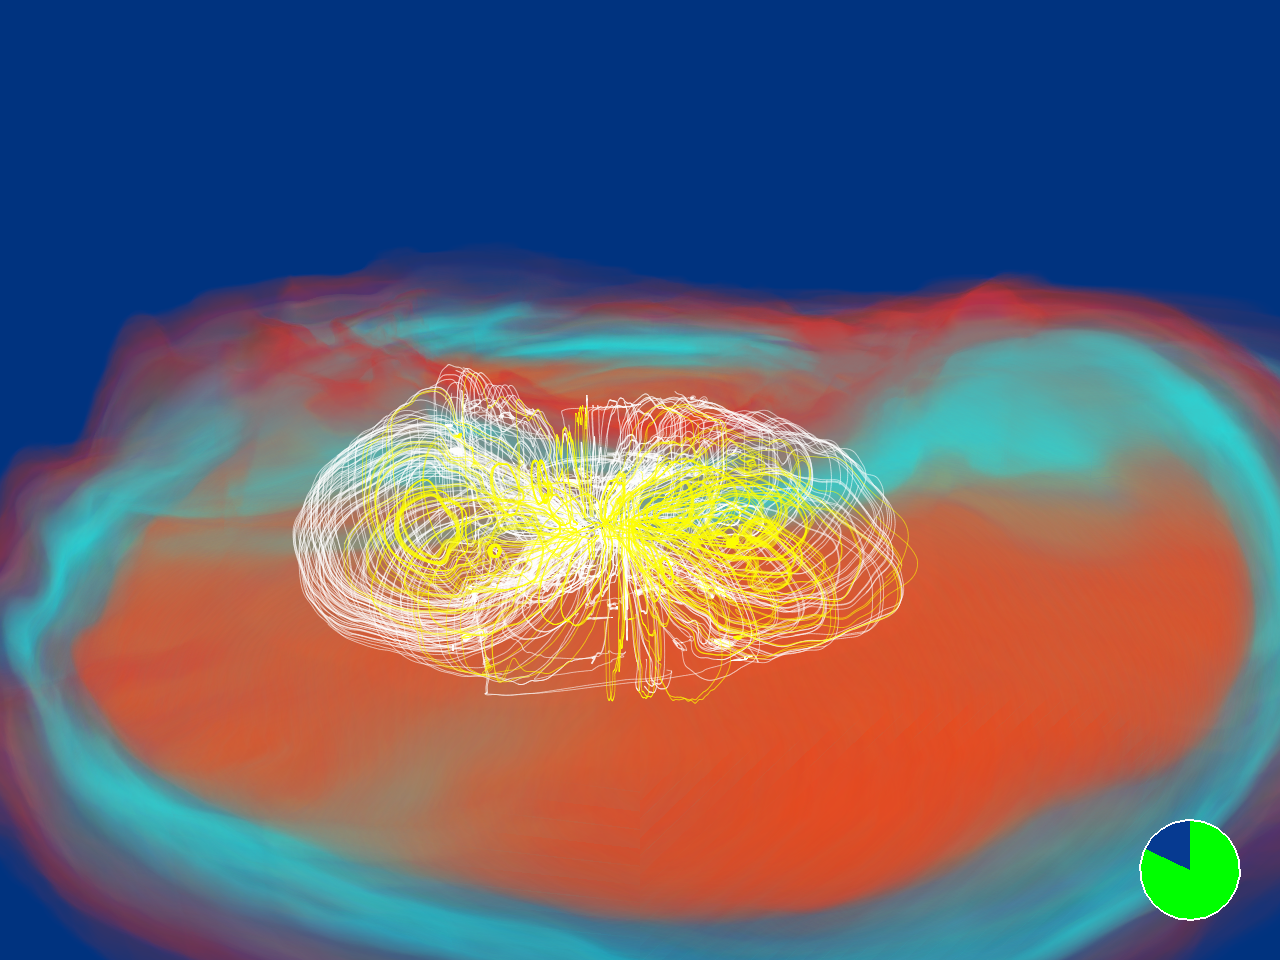 Fig. 1-1: Initial Configuration of Black Hole Magnetized Disk |
To visualize the magnetic fields near the polar regions of the black hole, two different set of points were used. The first set follows test-particle tracers in the simulation, and the particles are tied to the frozen-in B-field lines as they move through space. The other set involves a regular grid of points tethered to the black hole, and the B-field lines are then traced through this fixed grid at all times.
In this visualization, the simulation evolved a set of test-particles and followed their trajectories. By tracing these particles through time, we are able to watch the evolution of frozen-in B-field lines, as these lines are attached to the same particles for all time.
Instead of visualizing all 5000 particles generated, we elected to show two subsets of these particles. One set (visualized in white) was chosen to best represent the polar collimation that occurs in later stages of the evolution. The other set of particles (visualized in yellow) are chosen to illustrate the B-fields present in the disk, and the toroidal shape they develop. In the beginning of the simlation, the disk is threaded by the seeded poloidal magnetic field. As the simulation progresses, the field lines near the BH poles twist and collimate as in a barber-pole.
The field lines representing the final collimated magnetic fields near the poles are rendered in white, and those representing the final toroidal magnetic fields in the disk are in yellow.
Fig. 2-1: B-field profile at time t/M = 2154 |
 Fig. 2-2: B-field profile at time t/M = 2257 |
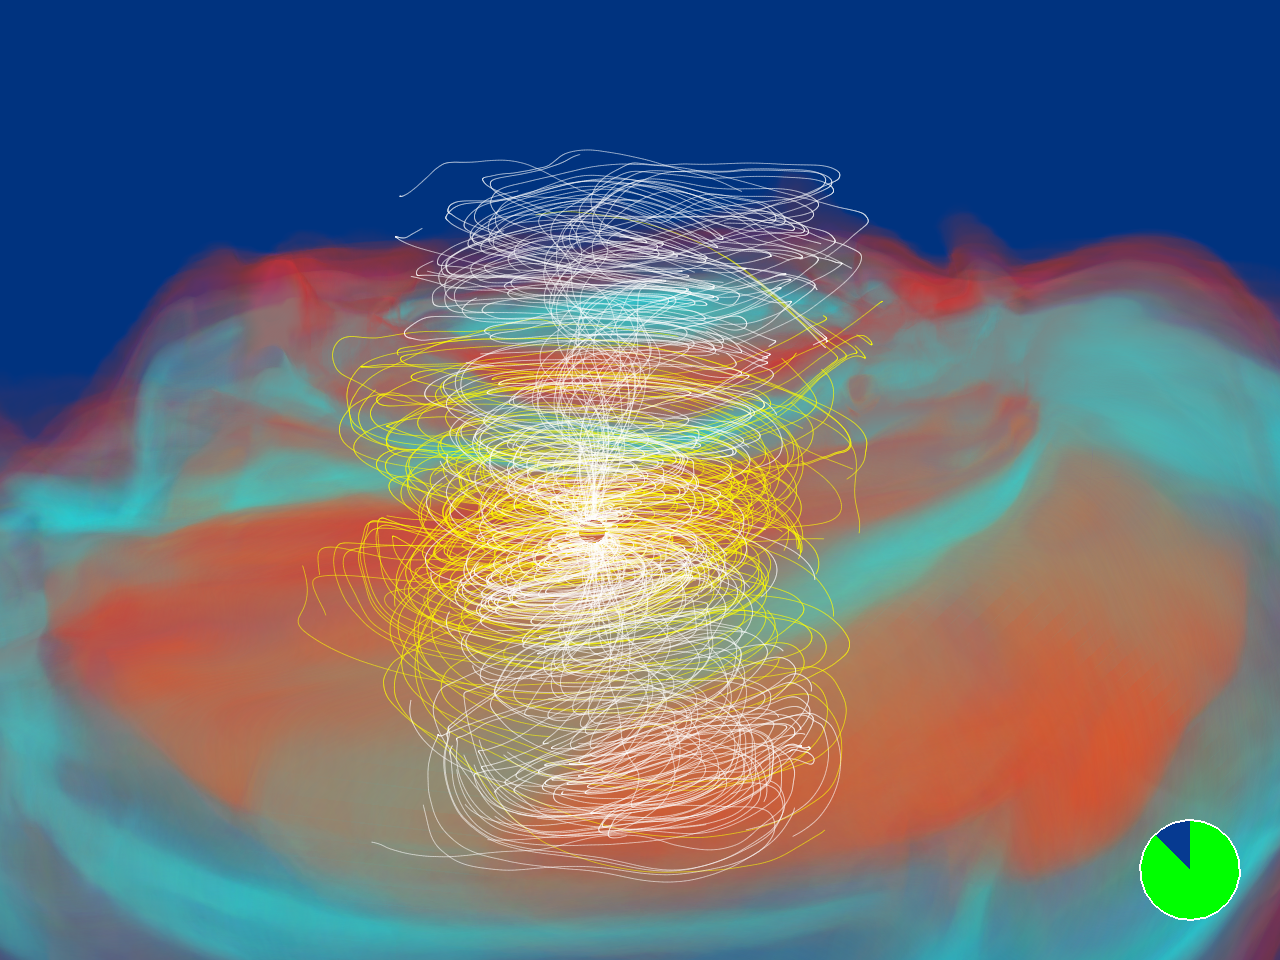 Fig. 2-3: B-field profile at time t/M = 2299 |
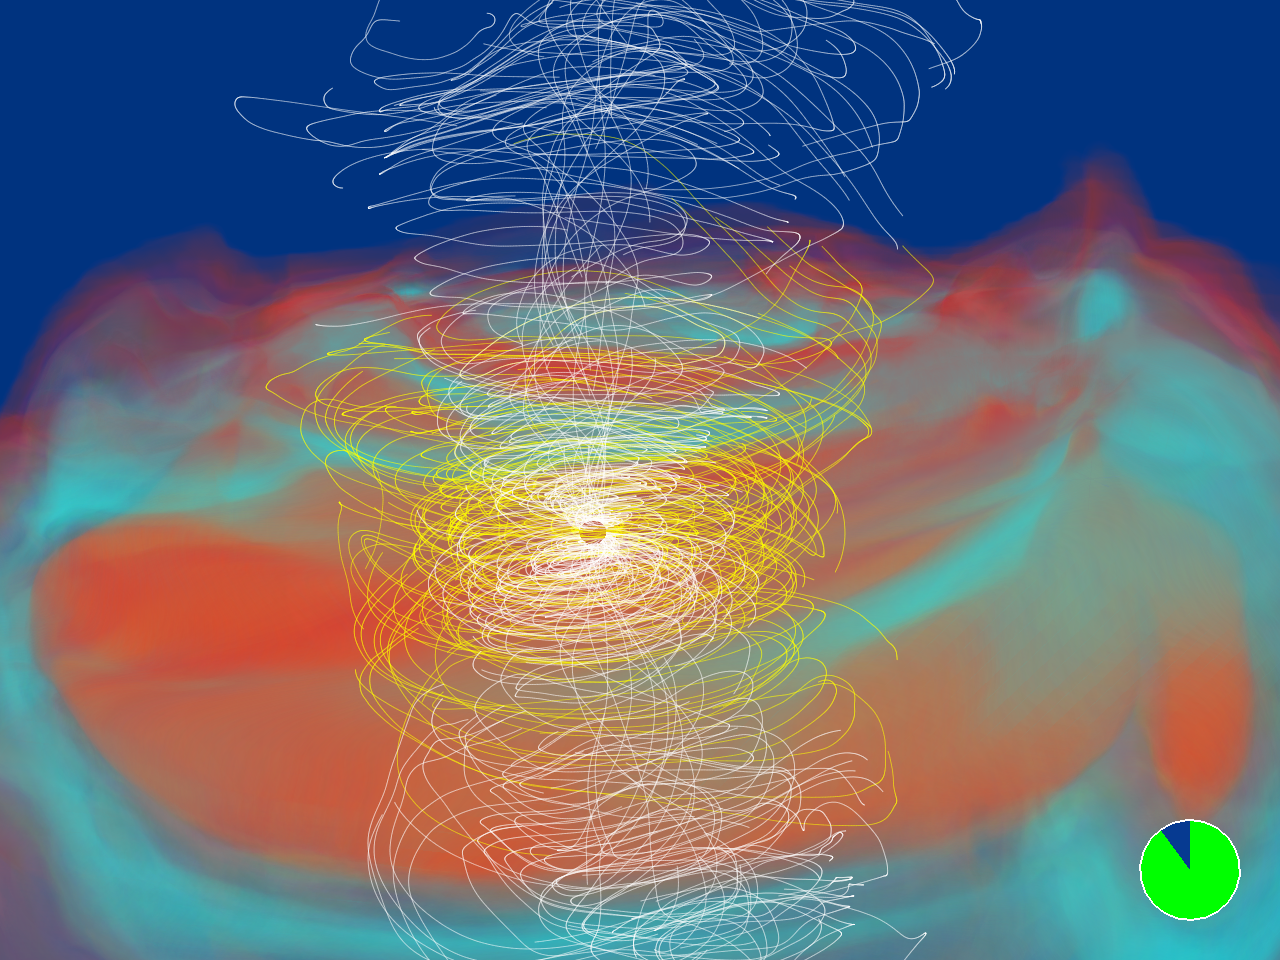 Fig. 2-4: B-field profile at time t/M = 2340 |
For this visualization, magnetic field lines were drawn through a set of grid points. These grid points were circular disks at fixed heights above and below the black hole. This visualization demonstrates the twisting and collimation that arise from the initial disk with a purely poloidal magnetic field. This visualization exhibits similar qualities to those from the test-particle visualization above, but it is able to run longer (t/M = 2596) because it does not rely on positions of a finite set of pre-identified particles. The field lines are rendered in white.
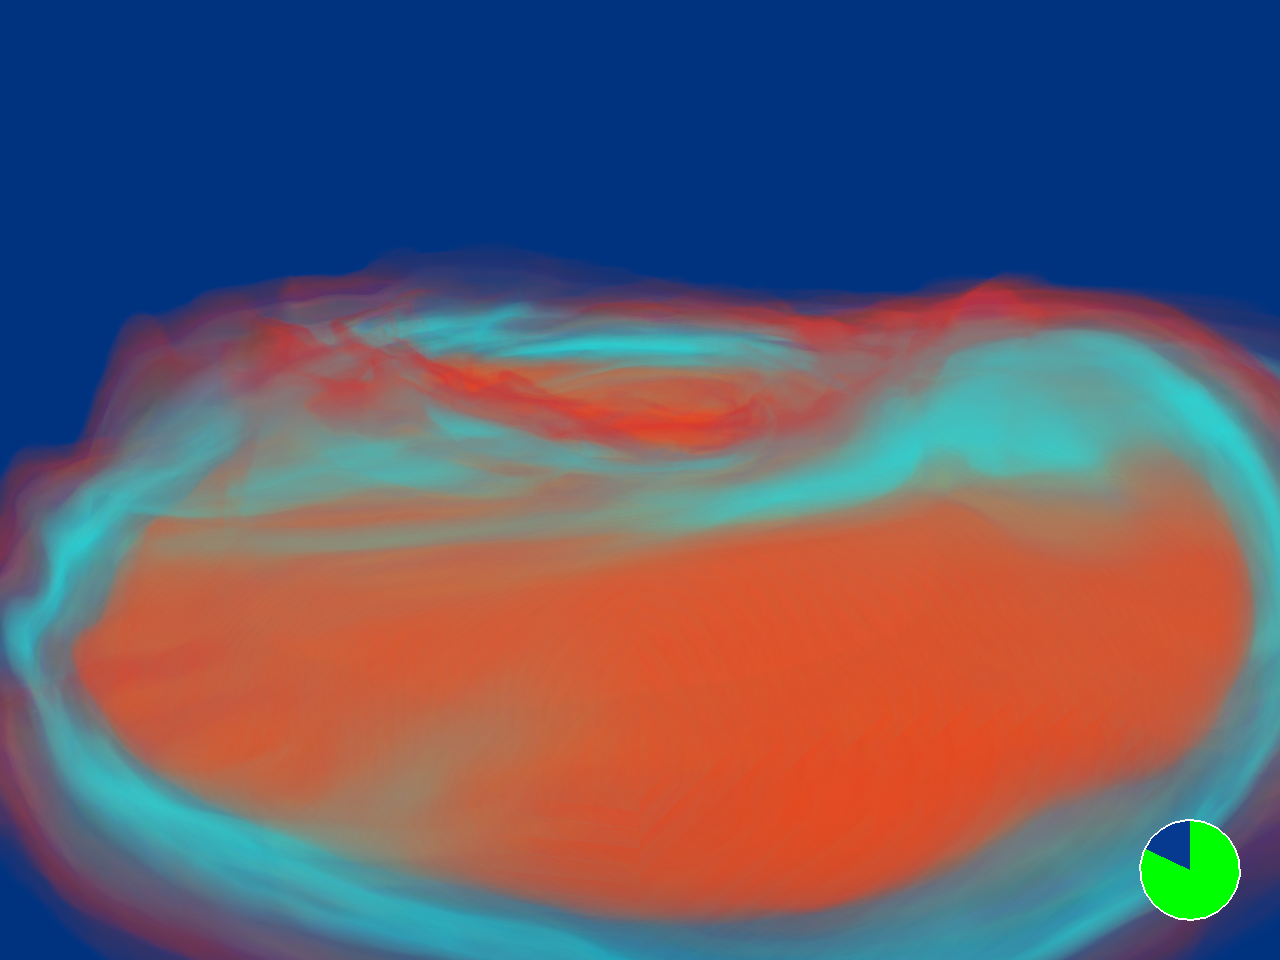 Fig. 3-1: B-field profile at time t/M = 2151 |
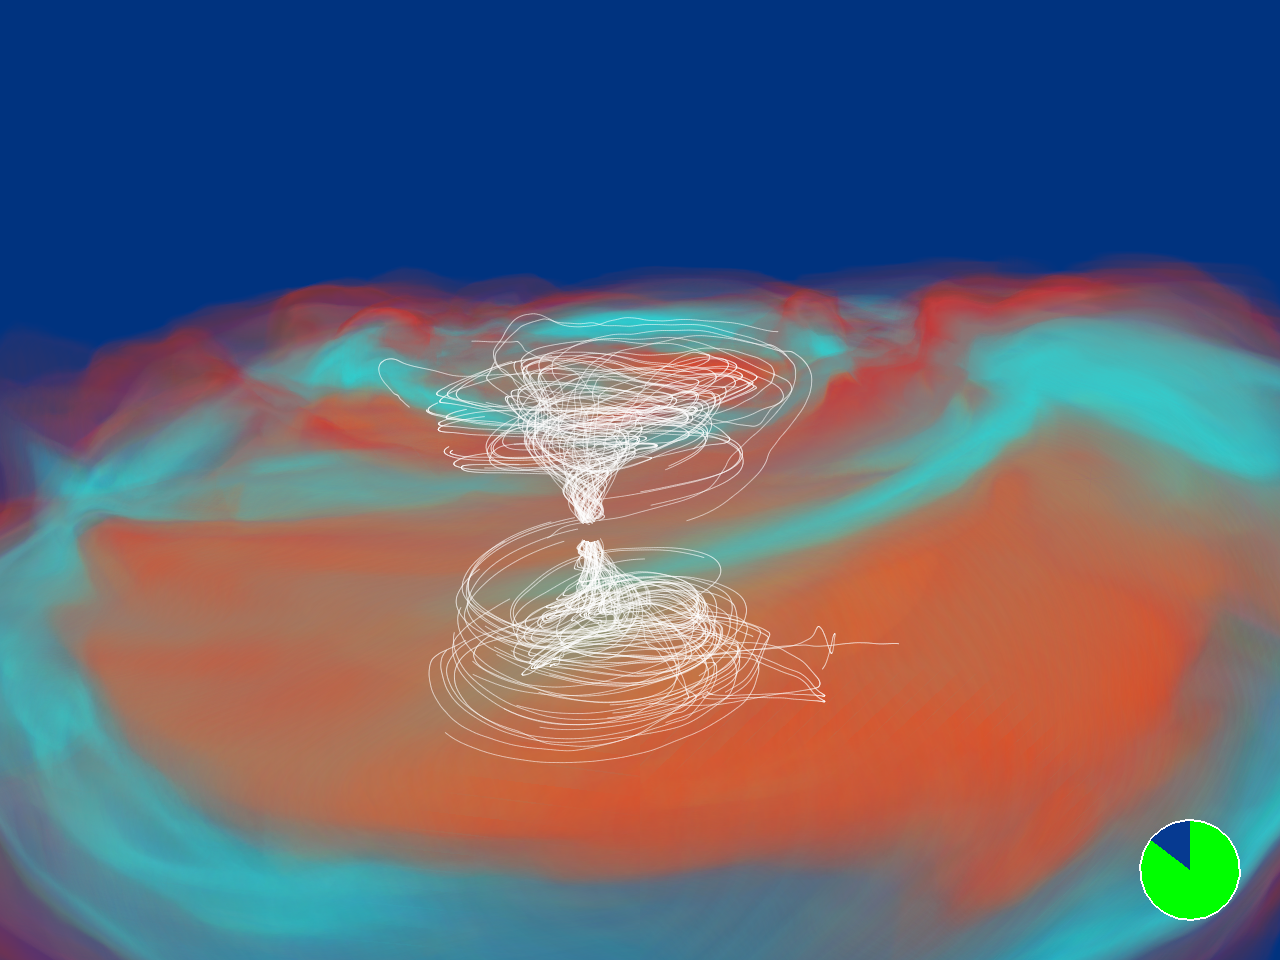 Fig. 3-2: B-field profile at time t/M = 2238 |
 Fig. 3-3: B-field profile at time t/M = 2404 |
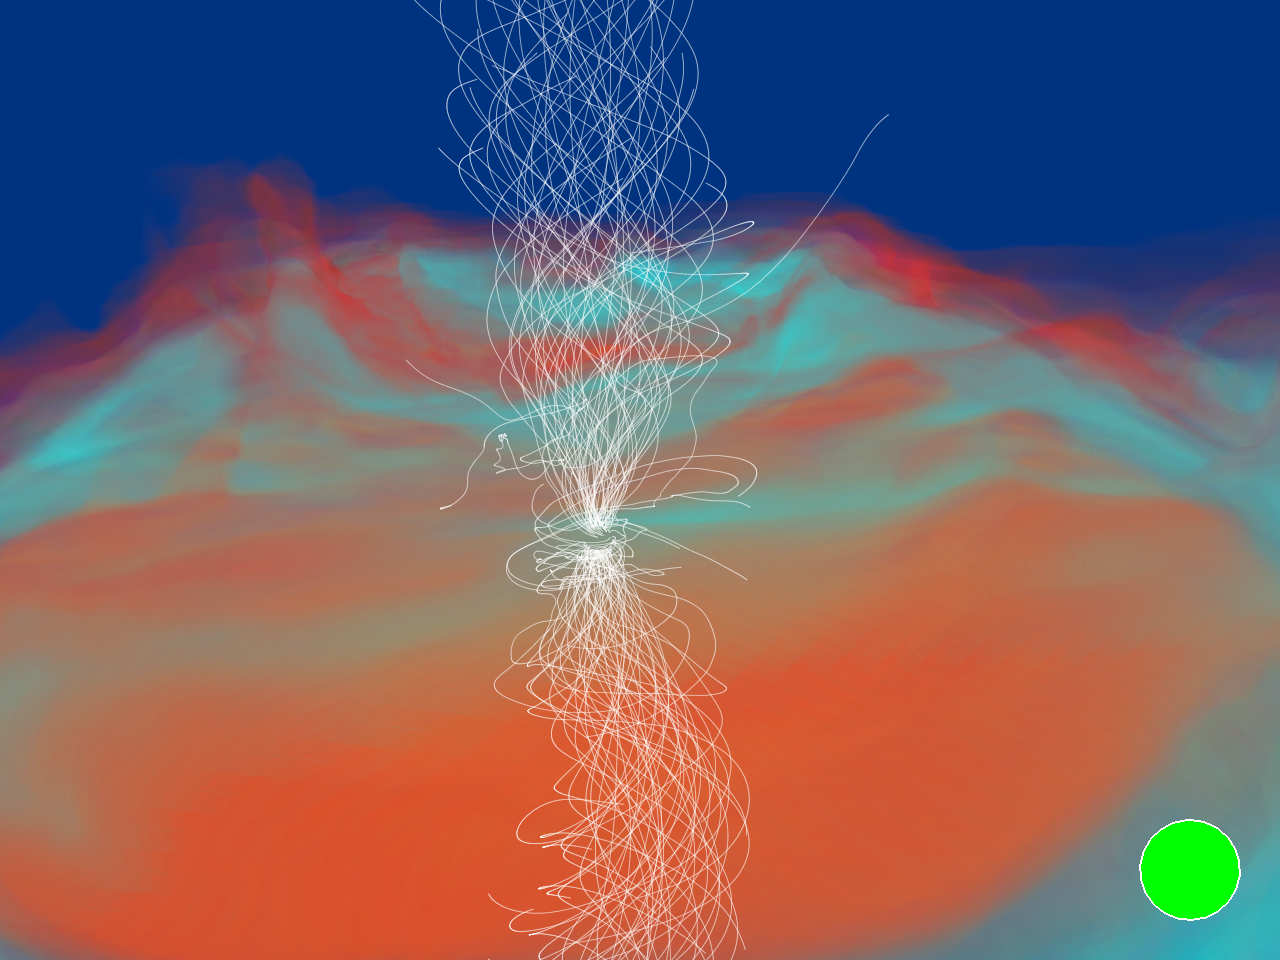 Fig. 3-4: B-field profile at time t/M = 2596 |
| Illinois Relativity Group---University of Illinois at Urbana-Champaign Group Members | Publications | Movies | Links |
last updated 12 Nov 2014 by lkong5