Case C

Case C
Introduction
Evolution of Density Profile
Evolution of Density
Profile with Velocity Field
Evolution of Entropy Profile
Evolution of Gravitational Radiation Profile
Final
Black Hole Parameters
Introduction
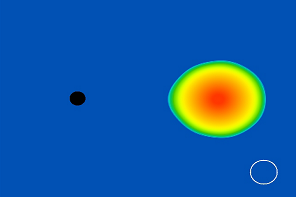
Fig. 1-1 Initial Configuration of Binary
Evolution is performed on a 610x610 multiple-transition
fisheye adaptive grid. In this simulation, the intial binary coordinate separation is D/M = 8.61,
and the inital angular momentum of the system is J/M2 = 0.936.
Evolution of the Density Profile
In the clip from the equatorial plane, the rest-mass density of the neutron star is plotted on a logarithmic scale normalized to the initial central density. The gravitational field is evolved via the BSSN scheme using "moving puncture" gauge conditions. The relativistic hydrodynamic equations are solved using a high-resolution shock-capturing (HRSC) method.
We see tidal disruption and the onset of accretion after approximately 0.5
orbits (t ≈ 90 M), with matter flowing in a narrow stream through the inner Lagrange point and
into the black hole. The accretion flow then accelerates as the NS is consumed by the black hole.
Later, at t ≈180 M, we see a shock front develop when material in the leading spiral edge of the disrupted neutron star crashes into the trailing edge. At the end of our simulation (t = 300 M) the fraction of the rest (baryon) mass inside the
apparent horizon is greater then 97%.
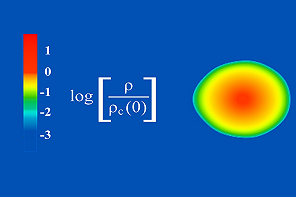 Fig. 2-1 Color code for density profile | Fig. 2-2 Density Profile at t = 0 |
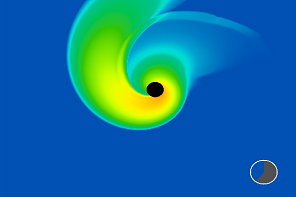 Fig. 2-3 Development of Shock Front at t/M = 180 | 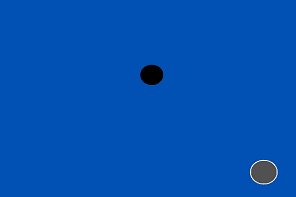 Fig. 2-4 Density Profile at t/M = 300 |
Evolution of Density Profile with Velocity Field
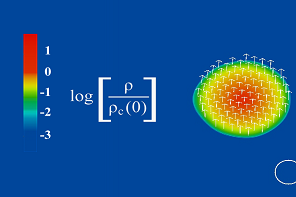 Fig. 3-1 Color code for density profile |
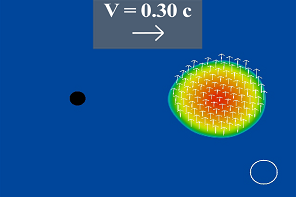 Fig. 3-2 Density Profile at t = 0 |
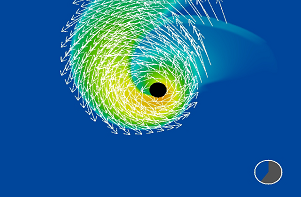 Fig. 3-3 Shock Front at t/M = 180 | 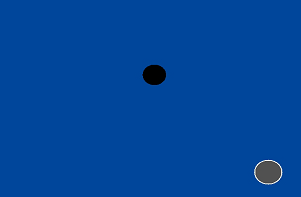 Fig. 3-4 Density Profile at t/M = 300 |
Evolution of Entropy Profile
During the evolution, shocks develop and the matter heats up, resulting in an increase in the entropy parameter K ≣ P/(ρ0Γ) from its initial value K0. The ratio K/K0 is clearly larger than unity in the region where a shock is formed from colliding matter in the spiral arms. (Fig. 4-3)
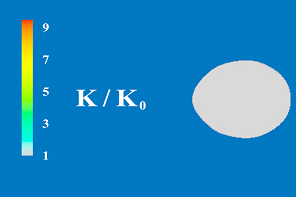 Fig. 4-1 Color code for entropy profile |
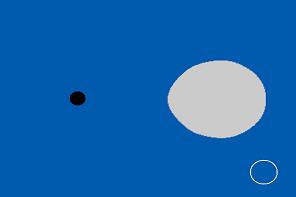 Fig. 4-2 Entropy Profile at t = 0 |
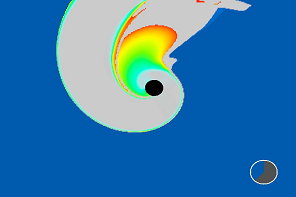 Fig. 4-3 Shock Front at t/M = 180 | Fig. 4-4 Entropy Profile at t/M = 300 |
Evolution of Gravitational Radiation
Profile
The gravitational wavetrain from a compact binary system may be separated into three qualitatively different parts: the inspiral, merger, and ringdown. During the inspiral phase, which takes up most of the binary's lifetime, gravity wave emission gradually reduces the binary separation. The merger phase of the gravitational wavetrain is characterized by tidal disruption of the neutron star. Finally, ringdown radiation is emitted as the distorted black hole settles down to Kerr equilibrium. Both polarization modes are shown.
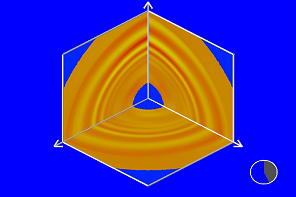 Fig. 5-1 h+ Profile |
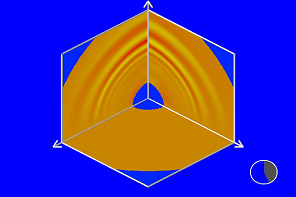 Fig. 5-2 hx Profile |
Final Black Hole Parameters
Listed in the table below is the dimensionless spin of the Kerr black hole at the end of our simulation. Also shown are the radiated energy, angular momentum, and linear recoil velocity resulting from gravitational wave emission.
| JBH/M2BH | 0.80 |
| &Delta JGW/M2 | 5.4% |
| &Delta EGW/M | 0.4% |
| Recoil velocity | 20 km/s |
last updated 10 December by aakhan3