Case A1-farbc

Case A1-farbc
Introduction
Evolution of Density Profile
Final Black Hole
Parameters
Introduction
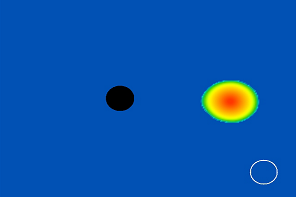
Fig. 1-1 Initial Configuration of Binary
Evolution is performed on a 604x604 multiple-transition
fisheye adaptive grid. In this simulation, the initial binary coordinate separation is D/M = 5.41,
and the initial angular momentum of the system is J/M2 = 0.629.
Evolution of the Density Profile
In the clip from the equatorial plane, the rest-mass density of the neutron star is plotted on a logarithmic scale normalized to the initial central density. The gravitational field is evolved via the BSSN scheme using "moving puncture" gauge conditions. The relativistic hydrodynamic equations are solved using a high-resolution shock-capturing (HRSC) method.
We see tidal disruption and the onset of accretion after approximately 0.5 orbits (t ≈ 50
M), with matter flowing in a narrow stream through the inner Lagrange point and into the black hole.
The accretion flow then accelerates as the NS is consumed by the black hole. Later, at t
≈120 M, we see the beginnings of mass loss outward into a disk through the outer Lagrange
point, but the mass stream is quite tenuous. At the end of our simulation (t = 210 M) the fraction
of the rest (baryon) mass inside the apparent horizon is greater then 97%.
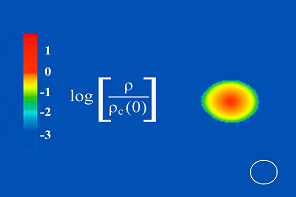 Fig. 2-1: Color code for density profile |
 Fig. 2-2: Density Profile at t = 0 |
 Fig. 2-3: Density Profile at t/M = 120 |
 Fig. 2-4: Density Profile at t/M = 210 |
Final Black Hole Parameters
Listed in the table below is the dimensionless spin of the Kerr black hole at the end of our simulation. Also shown are the radiated energy, angular momentum, and linear recoil velocity resulting from gravitational wave emission.
| JBH/M2BH | 0.52 |
| &Delta EGW/M | 0.7% |
| &Delta JGW/M2 | 6.0% |
| Recoil velocity | 15 km/s |
last updated 10 December by aakhan3