Density Plots

Because the dynamical range in space is very large, the PN simulation was done in comoving coordinates. The polar radius ranges from Rp/M = 411 in the beginning to 4 at the end of the simulation. To deal with this problem while visualizing the results of the simulation, we display our density plots in these comoving coordinates. The scale factor, a, that relates comoving to physical coordinates is determined by the following:
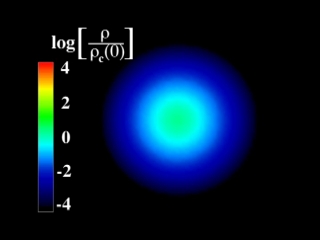
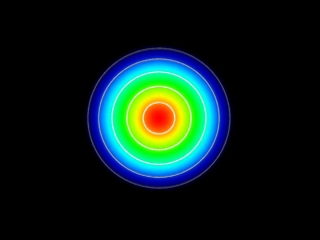
Equatorial Plane
|
t/M = 0.00
|
t/M = 30,360
|
|
|
Here we show the evolution of densities in the equatorial plane. Density is normalized to the initial central density, and our color code is shown above. A nonaxisymmetric perturbation is introduced at the beginning but does not grow. Thus, the star preserves axisymmetry.
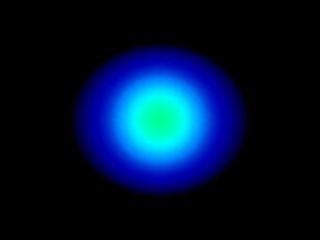
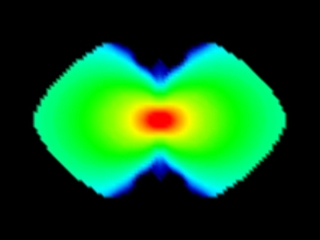
Meridional Plane
|
t/M = 0.00
|
t/M = 30,630
|
|
|
Here we show the evolution of densities in a meridional plane containing the rotation axis. We use the same color code as in the previous movie. Flattening of the star near the rotation axis is evident by the time the simulation terminates.
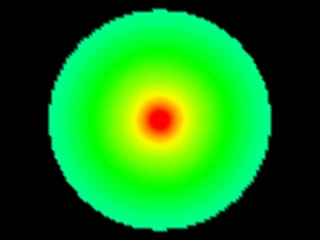
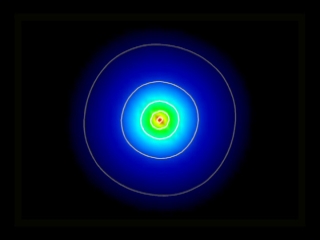
Equatorial Plane
|
t/M = 0.00
|
t/M = 30,360
|
|
|
The above scene shows the equatorial plane with a dynamic density scale that is normalized to current central density. We draw contours at 0.5, 1.5, 2.5, 3.5, and 4.5 decades below central density. If collapse were strictly homologous, there would be no difference between the initial and final pictures.
last updated 6 Nov 14 aakhan3