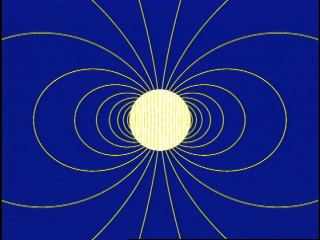
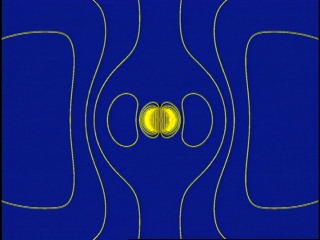
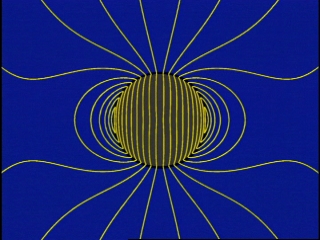
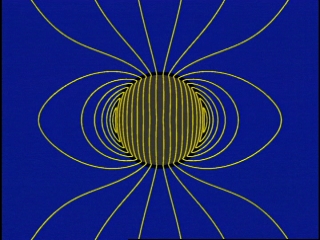
| t/M = 0.00 | t/M = 7.9 |
|
|
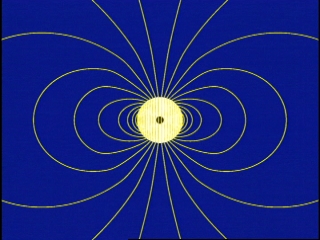
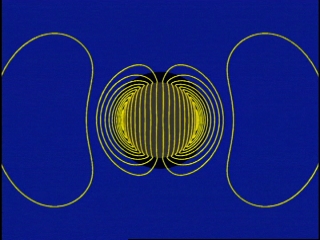
| t/M = 11.9 | t/M = 12.1 |
|
|
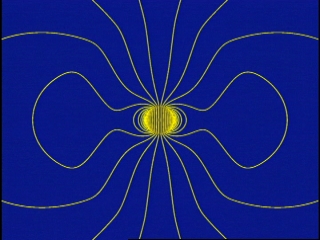
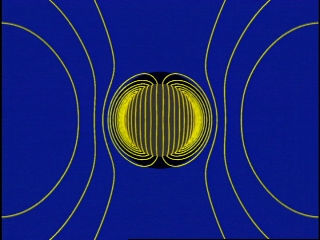
| t/M = 17.0 | t/M = 20.7 |
|
|
Download Quicktime (9 MB)
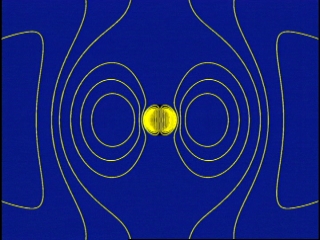
| t/M = 0.00 | t/M = 7.9 |
|
|
|
| t/M = 11.9 | t/M = 12.1 |
|
|
|
| t/M = 17.0 | t/M = 20.7 |
|
|
|
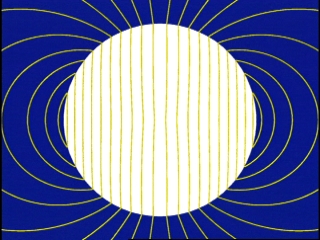
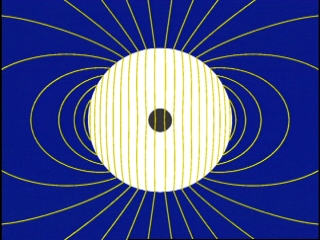
| t/M = 0.00 | t/M = 7.9 |
|
|
| t/M = 11.9 | t/M = 12.1 |
|
|
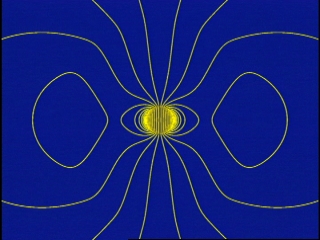
| t/M = 17.0 | t/M = 20.7 |
|
|
Blow-up of the same collapse . Note how in this gauge the stellar surface approaches a limit surface at rs ≈ 3/2 M at late times. The horizon grows to its final value rs = 2M once all the matter crosses inside this radius.